Editor’s note: This article first ran on February 17, 2020 in Daily Coffee News; it is republished here with permission.
The Specialty Coffee Transaction Guide released its latest and largest update just a few days before the end of 2019. The Guide itself is a continuously evolving compendium of financial data donated by willing participants in the importing and roasting segments of the specialty coffee industry.
We at Royal Coffee are proud to be donors, and to have hosted an enlightening panel discussion on the topic that included panelists and coffee professionals Mayra Orellana-Powell, Luiz Saldanha, Jeri Idso, and the SCTG’s two project leaders, Chad Trewick and Dr. Peter Roberts. The latter two kindly responded at length to a recent inquiry of mine, and some of their commentary is peppered into the article below.
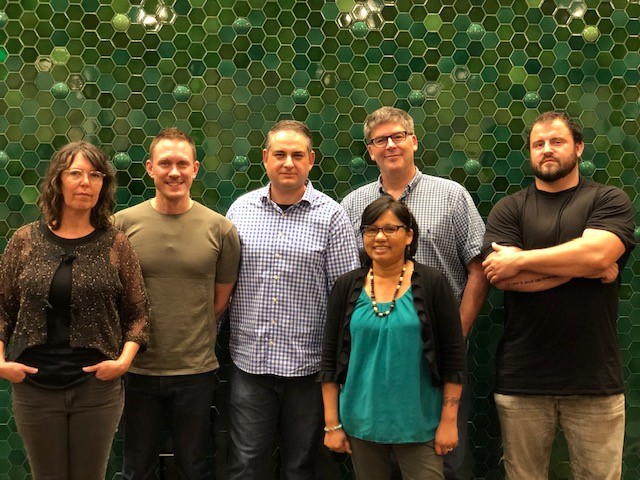
The Specialty Coffee Transaction Guide panelists at The Crown in November 2019. From left: Jeri Idso, Chad Trewick, Luiz Saldanha, Dr. Peter Roberts, Mayra Orellana-Powell and Max Nicholas-Fulmer.
What is the Specialty Coffee Transaction Guide?
The crux of the Guide is to divorce the specialty coffee industry from the C-market commodities pricing conventions. It attempts to do this by serving as a descriptive and observational document highlighting the current market trends in the specialty coffee sector.
It’s a straightforward proposition, yet surprisingly difficult to execute. Despite full-throated support from specialty roasters large and small, the commodities futures market continues to dominate the conversation of coffee’s value. The year of 2019 proved to be among the final straws, as producers felt — and still feel — the brunt of a multi-year downswing into historic and sustained low prices, with months-at-a-time global pricing under $1 per pound.
The Guide has undertaken an effort to publish aggregated and anonymized data in order to quantify contract and pricing data across three major variables: quality (score), quantity (lot size), and origin (country). All data are self-reported by the donors, so each of these factors and their usefulness will be contingent to the accuracy — and subjectivity, in the case of cup score — of the provider.
That being said, what the guide has essentially produced is a reference for what the market is currently paying for a given quality tier at a given volume range.
This is incredibly useful for both buyer and seller, as it can help producers understand what their coffee is worth, and tip the imbalance of power in negotiation when they seek to sell their product. It can also help roasters understand where their particular prices fall in relation to other players in the market, and know what to expect when entering into cost discussions.
The Guide’s authors see it as part of an ongoing observation and reporting model, rather than a tool to prescribe actions. Chad Trewick told me that “we will try to be as close as possible to 100% descriptive in the Guide while working, alone and with others, on additional research.”
What are the key takeaways and analyses?
Price Stability & Volume of Data
Over the past three years of data collection, the median price per pound for specialty coffee hasn’t changed dramatically: It’s $2.80 per pound. High and low percentile prices sank slightly over the same time period, but not as dramatically as the C-market.
This is especially impressive given the volume of donated data, particularly in the most recent year. 17,315 contracts representing 279.4 million pounds of coffee valued at over $625 million USD are represented in the 2018-2019 data, more than a 50% increase in contributed numbers over the previous 12 months.
Trewick said that the number of data donors this year increased from 21 to 57, while mentioning that he and Roberts sought out larger donors intentionally to “present more representative information to the specialty coffee industry. “
Throughout 2019, we heard that our data speak only for the smaller and fancier specialty coffee buyers,” Trewick said. “With the volume and diversity of data behind the 2019 Transaction Guide, this is now a hard argument to make.”
What percent of the whole specialty coffee pie does the Guide represent? Dr. Roberts noted that the figure is hard to pin down “because of the uncertainty surrounding the boundaries and definitions of the specialty market.” Roberts continued, “Our estimates indicate that between 6% and 10% of specialty coffees traded over the last three harvest years are included in the 2019 Transaction Guide.”
It’s a sizable chunk, to be sure.
Relative price compared to lot size and quality tier
It’s not rocket science, but the data show that “higher-quality coffees tend to receive higher prices.” That’s specialty coffee’s founding premise, in a nutshell: “We pay more for good coffee.”
In general, prices moved relatively little from year to year. Overall, this indicates that the specialty industry has developed some de facto stabilizing measures.
The Guide’s authors also note that “the median prices for the more ‘ordinary’ buckets… roughly matches the prevailing Fair Trade minimum price for conventional coffees.”
This could be interpreted in a few ways: One could say that FT has accurately aligned its numbers with the market’s pre existing position for minimum pricing; alternatively, perhaps, specialty coffee buyers have tacked their minimum pricing close to the FT mark.
In either case, the $1.60 per pound figure for bulked specialty blenders seems an appropriate minimum price range, regardless of whether the C-market is at $1.40 or $1.00
Additionally, small lots are shown to gather higher prices per pound than large lots. While its probable that most small lots also tend to score better than large ones, there’s also likely an intersection with the economics of scale. It’s easier to absorb costs when producing at higher volumes, and it’s cheaper by the pound to buy in bulk. That principle — along with supply/demand and “there’s no such thing as a free lunch” — basically sums up what my dad taught me about economics in middle school.
Free on Board (FOB) Pricing
Our industry continues to rely on the “Free on Board” (FOB) price, which rolls together the costs of production with transportation and processing and export.
You could think of FOB as the exporter’s “sticker price.” It’s a good starting point, but one that ultimately obscures what the individual farmer or local cooperative might be taking away from the export price.
Out of a $3/lb FOB coffee, a smallholder with processing capabilities might be taking away, speculatively, perhaps $1.50, while a cooperative member likely sees a much smaller fraction. Additionally, higher FOB prices do not necessarily mean higher prices further back in the chain.
More transparency is needed. You can find a more detailed discourse on this topic in Royal’s blog post about The Pledge and Price Transparency.
The Guide’s authors are well aware of the need, and Trewick said it is a priority for future work. “We have already started conversations with several producing country organizations who are potential partners for us in the calculation of things like average in-country costs, best practices around sustainable cost to produce, etc,” Trewick said. “This will help us to generate a series of conversion tools that empower users… to arrive at values that have more to do with what a producer should receive at her or his farm gate in local currency, unit of measure, and pertaining to the appropriate stage in the process — cherry, parchment, etc. — We know this is a critical step toward ensuring the information within the Guide is useful and extending to farmers themselves.”
Number of Contracts vs. Total Weight; Median vs. Mean Pricing
There are many different ways of looking at the data, yet throughout the Guide, the default figure used to determine a dollar amount per pound is the median number of contracts.
The result is a confident stability in $2.80 as a median price per pound — when looking at all the data at once. This single number is by nature reductive, and the guide has undertaken to break the data into more representative chunks based on some quality (cup score) and quantity divisions.
However, the Guide’s choice to represent figures based on the volume of contracts drawn, rather than the weight of coffee bought and sold, skews the overall median upwards.
Table 4 in the Guide breaks out contracts by weight tiers, and makes it clear that despite similar number of contracts drawn for both the “40,000-plus” tier, and the “less than 1,000 lb” tier in 2018-2019, the weight represented by these contracts is vastly different: 170.9 million to 1.8 million, respectively.
Nearly 95 times more coffee, by weight, was traded on the same number of contracts in these two different tiers. The figure below details the relationship of number of contracts versus volume of coffee traded, to further illustrate this point.
While it’s not surprising in itself that, by weight, there’s more 82-point coffee in the market than 88-point coffee, it bears mentioning that by treating the number of contracts as equal, the median number represents a far higher price per pound than the average by weight. The obvious implication is that in the highest quality tiers, more contracts are signed but they represent less coffee. Conversely, at lower quality, fewer total contracts are written but these represent significantly-higher-volume trades.
The result of SCTG’s reliance on median price by volume of contracts rather than looking at weights traded is to place more importance on those quality tiers that get more contracts — e.g., the 86-88s, as shown above — rather than the quality tiers that move greater amounts of coffee, like the 82-84 tier.
Viewed another way, if we were to look at median weight instead of median number of contracts, the 50% percentile score would end up around 84, as opposed to the median contract score which is closer to 85.5 (represented graphically below).
If the price per pound in the Guide were based on an average price per weight of beans rather than volume of contracts — as can be gleaned with a little math from SCTG Table 3 — then an average (mean) price per pound would be closer to $2.26 from 2016-2019, fluctuating from $2.19 to $2.35 by year. You can compare these figures in the chart below.
This is even more enlightening if you click through to the second tab, where you can see that the median and mean keep pace fairly well, except in the highest quality tiers. The effect is that the large number of contracts drawn for tiny amounts of coffee at high dollar value has pushed the Guide’s median price of all tiers upwards.
As with all data representations, there are alternate ways of reporting the same figures. Both ways of looking at the data are accurate; they simply demonstrate different perspectives.
The statistician may value the median as a representative sample drawn, based on the number of transactions taking place. Royal CEO Max Nicholas-Fulmer suggested that this number “can potentially be viewed as the ‘micro lot premium’” and that “it may show that specialty buyers are to some effect rewarding producers for doing the extra work.”
Nicholas-Fulmer added, however, that “a farmer earns money by selling volume; much of the quality discovery and value-add is done further up the chain in cupping labs and dry mills, and I suspect a lot of this premium accrues at those levels.”
An argument could be made that the coffee buyer, seller, trader or grower may find a more faithful representation of the economic picture by looking at the weight of coffee traded, rather than the amount of contracts signed.
From a big picture perspective, if we’re talking about all self-identified “specialty coffee” that scores all the way from the low 80s to the upper 90s, the vast majority is still bought and sold in bulk.
Country of Origin and Relative Value
No matter how unjust it may seem given the increasingly universal languages of quality and markets, location still matters with regard to growing and selling coffee. The Guide notes significant differences at disparate origins that can be related to a number of factors, including supply and demand, exchange rate, the costs of living and/or the costs of production.
The Guide’s numbers are based on a regression model, attempting to predict FOB price per country by factoring out price differences based on size and quality tier, and presuming that what is left is “closer to the true effect of country-of-origin.”
It shows that Brazilian specialty coffee, for example, tends to cost less per pound than coffee grown in Kenya or Ethiopia. This example is pretty straightforward, but many of their other data points surprised me. My experience with many of their asterisked origins — outliers due to lack of data — tends to contradict many of Guide’s findings. For example, Burundi near the low end of price and Uganda near the high seems out-of-step with established market trends.
Any sample set is limited by the data input, and the authors of the SCTG acknowledge this at many points. To me, it seems a little more fair to omit the origin countries whose data they lack from the chart — as I’ve done below — thus limiting the speculative nature of their data.
I asked Dr. Roberts about this, and he told me that any country with less than 100 observations was redacted. But even the 100 threshold seems a small number compared to the large number of contracts drawn, and Roberts admitted “we elected to inform readers about sample sizes, so they can discount information as they see fit,” while mentioning that “we share the sentiment here and are anxious to get more data.”
To market traders, some of these numbers might still seem a bit off. Colombia tends to command a solid premium on margin trades against the C, for example, so why not for differentiated specialty? Is Kenyan coffee truly worth a premium almost three times more than the next country?
I’d submit that a far more scientific approach to this aspect would be an investigation into factors such as the exchange rate and the complexity of the supply chain in each country. This might include, to name a few factors, the average day labor wage for harvest, cost of transit over land to the mill and port, the rate of taxation upon exports, and the relative supply and demand from different regions of the world, each of which are rolled into that FOB “sticker price” the roaster or importer pays.
Another, more philosophical question I have on this topic: if a producer is selling one bag of an 88-point Kenyan coffee and another is selling one bag of an 88-point Brazilian coffee, do these qualitative similarities not deserve similar prices? Is it true that a $3.00/lb, 85-point Honduran coffee would be worth $3.80 if it were from Kenya and $2.40 if it were from Brazil?
I think that using this arbitrary distinction of country of origin fails to capture the inherent worth of coffee and labor by artificially drawing lines in the sand, and it obscures more objective factors such as the value of local currency, the cost of local transportation and labor, and the relative supply and demand of coffee from the region in question.
Trewick responded to the Guide’s choices here, telling me “In general, we feel that it is our job to report on the pricing data, leaving the interpretations and debates to others in the market.”
Point well taken, Chad, and interpretation offered. Let the debate ensue…
How to Know if Your Prices Are Fair?
Perhaps the ultimate goal of the Guide is transparency, both for buyer and seller, about the true value of the coffee they are trading. The document’s potential to leverage anonymous data and rectify negotiation imbalances is among its core virtues.
That said, the academic presentation of the data remains somewhat convoluted for a casual reader. Below, I’ve made an attempt to visually reframe the data, using the SCTG’s median pricing (the dots and lines) and top/bottom 5% (the shaded portions), graphed against quality tier and their arbitrary (but useful) quantity “buckets.” No data was altered; these are the exact figures presented in the Guide itself in Table 5, using data from 2018-2019.
You can click through the tabs at the top of the chart to visualize quality tiers individually. You can also tap on the color dots on the legend at the bottom of the chart to add or remove them from display.
Conclusions
Despite some arguable data-framing issues, and its inherent limitations based on FOB pricing and the inclusion of self-reported prices and quality tiers, the Specialty Coffee Transaction Guide has set a new standard by elevating the language of coffee pricing as it pertains to the specialty coffee industry.
While the Guide may not represent a complete roadmap, it’s as deft and complete a sketch as we have. When used as intended, it can provide both buyers and sellers some signposts for separation from margin calls on the C-market.
As with nearly all such academic approaches to real world scenarios, there are at minimum two calls to action for anyone wishing to make good use of the data.
The first is that more work must be done. We must strive to more precisely depict pricing norms based on demand for certain quality tiers, while also taking into account the importance of volume of coffee traded. More data couldn’t hurt. The Guide’s authors, are of course the first to call this out. Roberts mentioned to me that “results [in the Guide] are actually just observations; that will continue to become more reliable as we recruit more and more diverse data donors. So, we will continue to focus on more data and clearer presentation.”
The second is that better transparency can and should be the next step in serious research. How can we better describe costs behind the FOB sticker price for roasters and importers?
Another step may be taken, which is to attempt to better reconcile the disparity between buying power and selling power — that is, to examine the complex and multifaceted influences of production costs, imbalances of power, exchange rates, and other specific supply chain intricacies.
What’s more, the public data now garnered from impressive volumes of research may shape the ongoing narrative of coffee prices simply by virtue of its own existence.
Its authors are surely aware of this, and perhaps even benevolently complicit. Although reemphasizing their role as observers and impartial reporters, Roberts also admitted “it is no secret that we are among the many industry participants who feel that the historical information environment has not allowed specialty coffee markets to find prices that work — especially for producers — when it comes to short-term equity and long-term sustainability.”
Observation, after all, alters both the observed and the observer.
Latest Articles by Chris Kornman

Why We’re Temporarily Reducing Our Coffee Drink Prices
We’ve long maintained that tariffs were not just a tax on U.S. businesses, but on the American people. We’re finding creative ways to try and pay back that debt to our customers at The Crown. What? ...
Notes Between Cups, Volume 3
Chris Kornman on the hidden biases shaping every coffee cupping: how context, neighboring cups, and ritual influence sensory evaluation — and where the SCA CVA falls short.
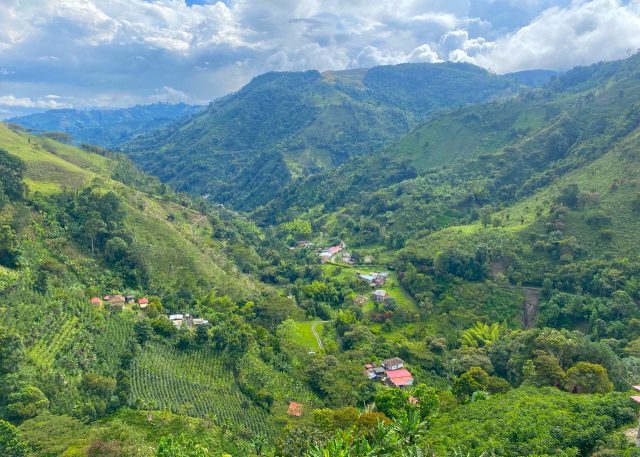
Colombian Coffee Regions and Varieties
Coffee grows throughout Colombia, with fresh harvests available nearly year-round. More than half a million coffee producers contribute to the country’s status as third in global export volume. Farmers grow traditional varieties, engineered hybrids, and...
Good job. This article is such a great reference for suppliers, roasters and coffee shops. Thank you Chris and Royal team.
Thanks for reading, Ahmad! And thanks to Chad & Peter and the data donors for making it possible, too!
This is a very approachable and useful dissemination of the SCTG. Very nicely done, Chris et al.
Aw shucks. Thanks Meister!