Editor’s Note: A version of this article originally appeared on Daily Coffee News here on December 5, 2016.
One of my favorite things about coffee is the potential for a multitude of experiences and opinions. No two people experience a coffee the same way, and while leaders in the industry are working on developing a common language, there are still so many important individual nuances to tasting.
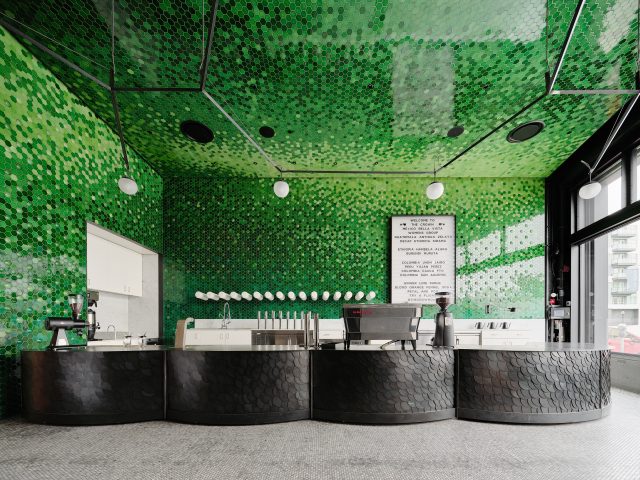
With our Crown on the Road education series, we had an unique opportunity to highlight some of the causes of varying experiences in the form of a class. I was curious to explore how things like context, cup color, and sensory distraction might affect flavor perception. The event was graciously supported by the good folks at Counter Culture Coffee’s Bay Area Training Center just up the road in Emeryville, and by Bonavita’s kind donation of a small fleet of their consistent and efficient 8-Cup Coffee Brewers. I also would never have been able to pull this off without the time and energy of my colleagues at The Crown: Evan, Jen, and Richard were invaluable resources from assisting with organization and planning to expertly and efficiently executing back-to-back-to-back large-format group tastings.
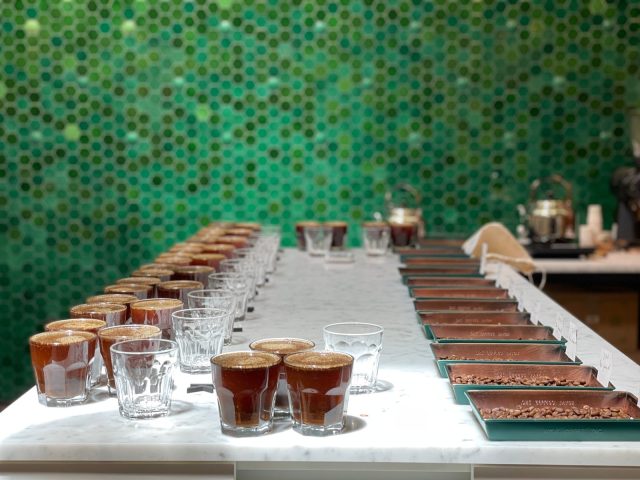
We set up three exercises. The first examined the effect of the color of a cup on sensory perception, the second looked at cupping context and what flavor perceptions might be altered by a coffee’s neighboring cups, and the final exercise used extreme sensory distraction in the form of molasses, vinegar, and soy sauce to examine the effect on taste.
I developed a very simple evaluation form to help judge three categories – sweetness, acidity, and viscosity – on a zero-to-three scale. Here’s what it looked like:
The event was attended by about fifteen people from a multitude of backgrounds, including a few people who had no professional coffee experience and a few people who had more than a decade in the business. We did a quick calibration before diving into round one, and I let everyone know I wanted to collect their data. I made no discrimination based on experience level or any other demographic. We did, however, run into one major data problem – some evaluators failed to complete their forms or finish evaluating parts of the exercise. I made a decision to delete their data if it was incomplete, on a coffee-by-coffee basis (that is, even if they didn’t complete an exercise but had evaluations for one full coffee set, their data would be included for that coffee). This was necessary to prevent uneven effects on a data-set.
Round 1 – How does the color of a cup affect perception of flavor?
20 sets of 4 different coffees were arranged into 5 different colored cups – Black, Red, Blue, White, and Clear. The four coffees were CJ1061 – Mexico, CJ1062- Ethiopia Worka Abera Gedela Raised Bed Natural Crown Jewel (both a dark and a light roast), and CJ1064 – Guatemala Xenacoj Guillermo Sanchez Double Washed Crown Jewel.

I was curious to experiment with this in a professional, coffee-focused format after reading an interesting article in the Washington Post about how a group of researchers tested lattes in white, blue, and clear glasses and found people thought the white mugs made the latte taste “more intense” but “less sweet.” (They also cite some other research on cup color’s effect on perception of temperature and bitterness and aroma, among other things).
Our results did not quite reflect the same definitive answers for brewed coffee. Here’s what we found: there were no universal trends across all coffees or colors, but there were some interesting micro-trends. Let’s look first at the Mexico:

The colored bars represent an average of the scores by the 10 tasters who completed the tasting, the color corresponds to the cup color, while gray represents a clear glass. The green bar is the overall average for comparison. You can see the blue cups ranked significantly higher in sweetness and acidity for this coffee. That trend holds true for the lighter roast of the Ethiopia, but interestingly not for the Guatemala.
Here’s the light roast of the Ethiopia:

This coffee already rated quite high in both acidity and sweetness, but again the blue cups seemed to enhance this perception. Another trend that continues on to the darker roast is the low rating for the red cup, especially in viscosity, and conversely the high viscosity rating for the black cups. Here it is:

For this darker Ethiopian coffee, we doubled up on the red cups to see if people were consistent. The answer was “not really.” Just one taster out of 15 total participants nailed it, scoring the two red cup samples identically… but that same taster had radically different scores for this very same coffee in different colored cups.
Let’s use the two sets of red cups of this darker roast of the Ethiopian coffee as a case study in consistency. A quick comparison of our best-performance attribute (sweetness, where 9 of 15 were within 0.5 on the two red cups) to our worst-performance attribute (viscosity, where only 4 of the participants were consistent) reveals the difficulty in maintaining objectivity in a complex environment.
Below, you’ll find a chart of each individual tasters sweetness rankings for this darker roast. Keep a close eye on the two red lines for each taster, and pay extra attention to individuals number 7 and 13, who aced the sweetness across all five samples. Incidentally, taster 13 was also completely consistent on the viscosity score for this coffee, and for viscosity on the Mexican coffee (they weren’t so consistent on other attributes elsewhere, but they get the gold star for the darker Ethiopian coffee).

Moving on, below is the last colored cup result, the Guatemala. In this example, the blue cups buck the trend of the previous samples. Tasters again demonstrated a lack of consistency across similarly colored cups, just 6 tasters scored sweetness similarly on the two identical samples, and the other two attributes were even less forgiving.

This was a tough exercise, compounded by the fact that there were 20 individual samples to taste, and three attributes to evaluate for each sample set. I might conclude two things from this exercise: our gustatory perception is most definitely affected by visual stimuli, but not in a consistent pattern depending on the coffee and the evaluator. Some tasters reported thinking the coffee in clear glasses was less viscous than others… but this perception wasn’t overwhelmingly supported by the group average. There were certainly other factors in play here, as well, like table position (we’ll examine this in the next exercise), or the large group setting, or the unfamiliar environment.
The other conclusion to make here is that sensory evaluation is really, really tough. The standard deviation average for individual tasters on a single attribute was over 0.5. What this means is that most tasters disagreed with themselves by 1 full point on every attribute on 2 of every 5 samples of the same coffee. Even tasters who demonstrated above average consistency on some coffees or attributes were inconsistent on others. For example: taster number 6 performed above average for sweetness and viscosity, but struggled with rating acidity consistently. Another example: taster number 12 maintained the group average on the Mexican and Guatemalan coffees, but was very inconsistent with sweetness on the Ethiopian samples. A brief summary of their standard deviations attribute by attribute appears below:


Round 2 – How do neighboring coffees affect each other?
I came up with this fun exercise a while back to highlight the effect of table position on a cupping. I would often see a mild coffee scored very very low when it followed an intense one, and I wanted to help people see how context affects flavor perception. I call the exercise “Forced Context.” In a set of three cups, the middle cup is a different coffee than the outside cups. The goal of the activity is to evaluate the center cup. The challenge is that the taster must taste the cups in order, from right to left, every time they want to evaluate the center cup.
We used the following coffees:
- CJ1042 – Ethiopia Gedeb Chelchele Double Washed Crown Jewel
- CJ1043 – Colombia Antioquia Caicedo Hector Vargas Fully Washed Crown Jewel
- CJ1047 – Honduras Santa Elena Catracha Community Bourbon Fully Washed Crown Jewel
- CJ1054 – Guatemala Huehuetenango Carlos Vasquez Solar Dried Crown Jewel
- CJ1055 – Kenya Nyeri Othaya Cooperative Gatugi Factory Double Washed Crown Jewel
Here was the table order that we cupped blindly:

Let’s highlight a few examples. First, the washed Ethiopian coffee (purple) crushed the competition in the sweetness category, and due to its unique flavor character seemed relatively unfazed by its neighbors, regardless of their intensity level.Once again, it’s easy to see that coffees were affected by their neighbors based on the results. However, the data do not support overarching trends: the effect of table position varies from coffee to coffee. Here are the color-coded results, organized by coffee and attribute (12 tasters turned in their results; I excluded 2 partial sets of results and 1 full set for incomplete scores that unfairly affected averages):

The Kenyan (yellow) coffee benefited from its Colombian neighbor in every category, and I suspect it also benefited from acclimation… I’d wager that people were more conservative with their scoring in early positions, but by the time they rolled around to position H they were prepared to unleash a 3 point acidity score. This subverted my expectation that intense neighbors might lower intensity rankings.
Two coffees trended more or less as expected. The Honduras (peach) next to the Kenya scored lower in every category than it did next to the Guatemalan coffee. Similarly, the Guatemalan coffee (green) seemed higher intensity in sweetness and acidity when positioned next to the Honduran coffee versus being flanked by the Colombia.

Round 3 – How do competing flavors affect coffee?
Everyone knows you’re not supposed to eat or drink right before cupping. But life doesn’t start and stop around coffee, and there will always be competing sensory stimuli, so I figured it might be fun and weird to try another forced context exercise – this time with non-coffee distractions. I warned everyone that the final round of tasting would be gross. We divided the room into three different tasting stations, where we tasted a few coffees from previous rounds, but first everyone had to taste either molasses, wine vinegar, or soy sauce.
Could anyone even taste the coffees after such intense, competing flavors? Many remarked that the coffees no longer tasted distinct… they just tasted like generic coffee. However, there were some interesting results. 13 tasters turned in data, three were eliminated from averages for incomplete scoring. Here is a visualization of the data, color-coded by the distracting flavor. I’ve included the average attribute score in green below from either Round 1 or 2 for comparison:

I thought for sure that the soy sauce (yellow) would make the coffees taste sweeter by contrast, but as you can see, the effect was actually very similar to the dollop of molasses (blue), reducing the perception of every attribute across all coffees. It’s interesting to me that 1042 Ethiopia held up a little better than the 1055 Kenya or 1064 Guatemala – even though the perception of its intensity was reduced, it still performed above the others in sweetness.
The other interesting observation is that the wine vinegar (orange) had the lowest impact on intensity rankings, despite many tasters voting for it as the least pleasant experience of the three. In fact, the vinegar actually had a positive impact on the Guatemala’s viscosity rating, the only instance of a sensory distraction improving the perception of intensity over the previous average.
Summary
Well, we had fun. I’m not sure we broke any new ground in terms of science, but these exercises (all of which are easy to repeat with a little setup work) were beneficial in terms of helping people become aware of different factors that influence perception. Sensory science is tricky, and particularly sensitive to distractions and competing stimuli. As cuppers, we’re often a coffee’s worst enemy at the table – unfairly judging a cup for its position on the table or because of an emotional instability (I’ve been cupping pretty poorly after the election results, for example). The more self-aware we are as cuppers, the better we can objectively evaluate the merits of a sensory experience. That’s the thing to take away. That, and to drink your Ethiopian coffees out of blue cups.
Latest Articles by Chris Kornman
Why We’re Temporarily Reducing Our Coffee Drink Prices
We’ve long maintained that tariffs were not just a tax on U.S. businesses, but on the American people. We’re finding creative ways to try and pay back that debt to our customers at The Crown. What? ...
Notes Between Cups, Volume 3
Chris Kornman on the hidden biases shaping every coffee cupping: how context, neighboring cups, and ritual influence sensory evaluation — and where the SCA CVA falls short.
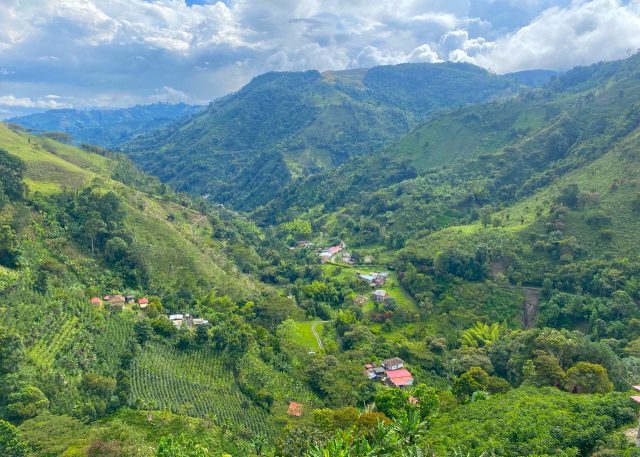
Colombian Coffee Regions and Varieties
Coffee grows throughout Colombia, with fresh harvests available nearly year-round. More than half a million coffee producers contribute to the country’s status as third in global export volume. Farmers grow traditional varieties, engineered hybrids, and...