When the Catracha Quality Project began, Catracha organizers encouraged producers to focus on the quality of the coffee by selecting ripe cherry. In the Royal Blog last week, Arvin Juan presented a post-harvest process map, the result of two years of observing practices and interviewing producers. It’s a visual tool for identifying best practices with producers in Santa Elena (if you haven’t been following this project, here is a good place to start).
Through the quality project, Arvin Juan, Lowell Powell and Mayra Orellana-Powell want to support specialty coffee production by standardizing the post-harvest process. Through data analysis, they want to understand current practices and identify potential enhancements and alternatives.

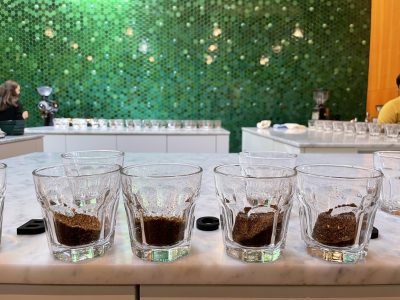
During the winter harvest months, seven producers agreed to record the weight of the picked and rejected coffee cherry and other information at four different micro-wet mills. After processing and before exporting, a sample from each pick was collected and shipped to Royal’s lab. In April, 43 samples were evaluated by cuppers from Blue Bottle Coffee, Flying Goat, Equator, Andytown, Mr. Espresso, and Tico Roasters.
The most immediate observation was that cup scores varied between picks, even from the same producer—for Antonacio Nolasco, the range was as much as 4 points (83 – 87). There was some variation for each producer, usually between 2 and 3 points. We wondered if there was any correlation between the average cup score and the percentage of rejected coffee cherry.
When you drill into this information for individual producers, there does appear to be a “window” where the percentage of rejected cherry correlates to a higher cup score. For example, looking at Louis Nolasco’s farm as a single anecdote, the highest cup score correlated to 5 or 6 percent of rejected cherry, with lower cup scores at both higher and lower percentages.

We see a similar window – with different percentages – for another individual producer, Santiago Lopez. The high score seemed to correlate to around 10 percent of rejected cherry with lower scores again found at higher and lower percentages.

This is also observed across all seven producers when joined on a single scatter plot together.

What can we say about this? Most importantly, this information will be valuable to bring back to Catracha producers, both individually and as a collective group. This will be important information to track over time.
One thought: it could be that these scatter plot show the natural progression of cherry ripeness, with early and late picks showing lower cup scores and correlating low or high percentages of rejected cherry. The peak season picks instead showing high cup scores and percentages in the window.
It should be noted, that not all results fit nicely into a window. Atanacio Nolasco’s coffee scored the highest when relatively little cherry rejected. The picks with higher percentages of rejected cherry all scored lower.

In short, we can bring this information back to Catracha producers. The data can be used as feedback, good information to help prepare for the upcoming harvest. This information reiterates the focus on quality and ripe cherry selection, Catracha’s core message. Going forward, as we compile similar data over years we will be able to hone potential enhancements and develop a standard method.

This is interesting, and I hope this data can help the folks back in Santa Elena.
But there is one thing that is not clear in this article. The variable tracked is the percentage of rejected cherry at processing. Does this rejection occur at the whole fruit intake station, or further on after some of the process has been run? If it is at whole fruit intake, has there been any attempt at teaching the pickers how to do this selection prior to actual picking of an individual cherry? Seems some picking crews may do better at this on average, thus presenting a better harvest resulting in lower percentage of rejected cherry. If it is not picked in the first place, it will not become part of the rejected cherry tally.
Two producers I know, one in Uganda another in El Salvador have described to me their method for reducing rejected fruit and raising the quality bar higher. Admittedly they both deal with much larger plots and seasonal picking crews. As the baskets of cherry come off the field to the collecting station, there is a highly skilled grader at that point. As the basket is spread out on the inspection table the grader quickly (and quite accuratly) scans the lot for quality, assigning a percentage to that lot. On that pickers talley for the day he will record the weight of that basketfull along with the grade presented. That lot then goes into one of several different bins, depending on quality. The picker will be paid not on weight alone, but per a simple formula that weights the grade picked and then applies that factor to the weight talley for each lot. The pickers very quickly learn they get more money at day’s end if they pick less quantity but higher quality. The producer now can command a premium price for a much better product. The El Salvador producer has taken a standard day’s pick and, as it worked its way though to “reposado”, decided as an afterthought to submit part of that lot into the COE. They picked a dozen bags at random from the sixty or so of the lot, never even opened or sorted them beyond their standard production system, and came out 12th or 14th in the COE. Its particularly gratifying to submit one’s “run of the mill” product and end up in that position.
I don’t know enough about the specifics of the harvest for the Catracha project’s contributors, but it seems further training in how to pick the best possible cherry would be one place to examine closely.
I have really enjoyed reading these in-depth articles on the Catracha project, It is particularly interesting to me, having met most of the US based individuals involved (Mayra, her Sister, Lowell, and, of course, Kevin, and have also actually had some of these amazing coffees here. While rather dear, they are worthy of the higher price.
Nick
Very grateful to have your input. You raise a great point. Can we improve the picking strategies to reduce the amount of rejected cherry? This is on our agenda for pre-harvest meetings with Catracha Producers in October. Stay tuned and we will have more details with the next harvest.
The quality project has been a great way for us to learn how Catracha producers do things. As part of our learning curve we are starting to see some of the gaps in our data collection and opportunities to improve next year.
We know how much cherry is rejected before it is processed. But, we did not capture the weight of the cherry that passed through the de-pulper but was then captured in the screen and rejected afterwards. We also did not capture the floater weight (also rejected). We certainly plan to get this data in the next harvest. Thanks again.